Progressive Web App Compatibility Test
Progressive web app compatibility test for Service Workers, offline storage, installability, push notifications, and background sync validation across browsers.
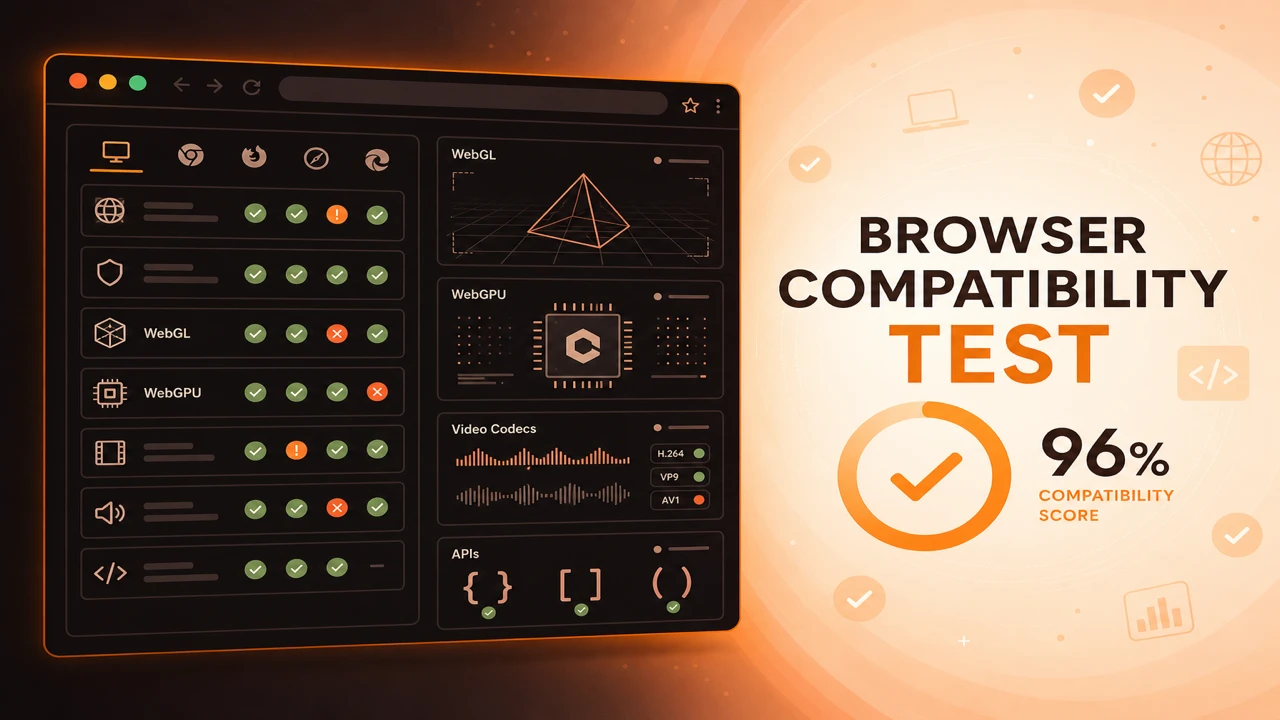
How to use the browser compatibility test tool for live feature detection, pass/fail diagnostics, capability scoring, and JSON export across WebGL, WebGPU, codecs, and APIs.
Our compatibility test tool on the run page executes client-side probes without uploading results. You get structured browser analysis across graphics, codecs, and APIs, plus compatibility reports you can export for QA tickets.
Formula
Session Report = Graphics Probes + Media Probes + API Probes
This article is part of Browser Compatibility Test. Open the compatibility test tool to run WebGL, WebGPU, codec, and API probes in your current browser.
The browser compatibility test tool performs live feature detection, browser analysis, and support validation with exportable compatibility reports and capability scoring.
Our compatibility test tool on the run page executes client-side probes without uploading results. You get structured browser analysis across graphics, codecs, and APIs, plus compatibility reports you can export for QA tickets.
The browser compatibility test tool performs live feature detection, browser analysis, and support validation with exportable compatibility reports and capability scoring.
Capability scoring summarizes pass rates for your selected probe scope. Filter by graphics, media, or APIs when debugging a specific subsystem.
Use exports to compare Chrome, Firefox, Safari, and Edge on the same checklist instead of relying on memory or screenshots alone.
Reference documentation tells you what browsers are supposed to support. The tool tells you what the browser in front of you supports right now, including driver quirks, policy blocks, and codec licensing limits that tables never capture.
If you are new to compatibility workflows, read what a browser compatibility test is first so probe scope, category filters, and scoring make sense before you interpret results.
Graphics probes attempt WebGL 2.0 and WebGL 1.0 context creation, then request a WebGPU adapter when the API is exposed. Media probes call canPlayType with standard MIME strings for common video and audio codecs. API probes verify object presence and basic callable behavior for platform features your progressive web apps and streaming tools depend on.
Everything runs client-side so results reflect the actual GPU, installed codecs, and enterprise policies on that machine. No account is required, and exports stay on your device until you choose to share them with QA or support.
After each run, generate a browser feature availability report and archive it beside your release tag. That habit makes regressions visible when a dependency upgrade silently drops codec or API support on a target platform.
Each session aggregates independent probes. One failure does not abort the suite, mirroring how resilient applications should degrade.
Export JSON after browser or driver updates to build a timeline of capability changes on your devices.
Category filters let you isolate graphics, media, or API failures during debugging. Use them when a user reports video issues but graphics probes still pass, or when API rows fail while codecs look healthy.
Session Report = Graphics Probes + Media Probes + API Probes
Apply these steps in order so compatibility results stay comparable across browsers and releases.
Open the run page
Navigate to the compatibility test tool and review probe scope and category filter options.
Configure probe menu
Choose quick, standard, or full scope and filter by graphics, media, or APIs as needed.
Start feature detection
Click Start Test to run all probes in sequence and watch pass/fail rows appear in real time.
Review live metrics
Check WebGL version, WebGPU status, codec count, API tally, and compatibility score in real time.
Export compatibility report
Download JSON for tooling or a text summary for email and support tickets.
A developer verifies WebGPU after enabling a browser flag. The tool shows adapter success, confirming it is safe to test an experimental branch locally.
Support asks a user to run the tool and send JSON. Engineers see WebGL disabled by policy instead of an application defect.
A mobile QA lead runs the tool on Android WebView before each store submission. Codec rows frequently differ from desktop Chrome, which prevents surprise playback failures in embedded browsers.
When scores drop after a browser update, support follows browser capability diagnostics to determine whether GPU policy, secure context, or extension conflicts caused the change.
The compatibility test tool turns topical requirements into actionable diagnostics on your machine.
Run it after OS upgrades, browser updates, or when a user report does not reproduce on your default setup.
Open Compatibility Test Tool
PWA
Progressive web app compatibility test for Service Workers, offline storage, installability, push notifications, and background sync validation across browsers.
Diagnostics
Browser capability diagnostics for troubleshooting missing WebGL, codec failures, API blocks, configuration problems, extension conflicts, and browser limitations.
Reporting
How to build a browser feature availability report from probe sessions. Document supported, unsupported, and experimental WebGL, codec, and API capabilities.